If you’ve been keeping up with the news, you’ve probably seen plenty of articles about an inverted yield curve. What does this mean, and as an ASX share market investor should you be worried?
What As A Yield Curve?
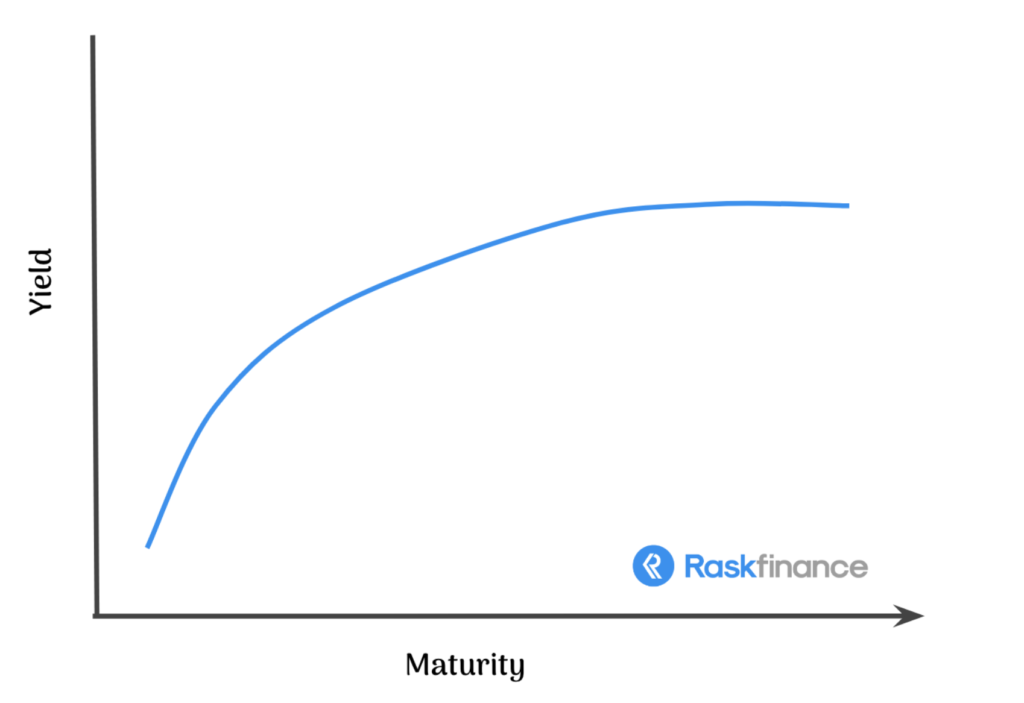
A yield curve is simply a graph that plots the yields of fixed-interest securities (aka bonds) against the length of time until their maturity. Basically, it compares the return you get on a short-term debt security (e.g. a three-month US Treasury bill) versus a long-term debt security (e.g. a 10-year government bond).
Typically, this curve slopes upward, meaning you will receive a higher yield/return from a long-term investment than a short-term one. The graph below shows this.
There are multiple theories as to why the yield curve should slope upwards, including that a long-term security/bond should provide a higher return because it reduces the liquidity of the investor.
But, at the most basic level, the yield curve is a visual representation of investor sentiment and market conditions.
For example, if the economy is expected to perform well in the next few years, you would expect that long-term securities would generate a higher yield. If the economy is expected to perform poorly, the yield curve may invert, meaning that short-term securities actually provide a higher return than long-term ones.
Inverted Yield Curve
In early 2019 the US yield curve inverted, meaning the yield/return on a 10-year government bond was less than that of a three-month US Treasury bill. The last time this occurred was in 2007, right before the Global Financial Crisis. It also occurred in late 2005 and 2006, leading up to the GFC.
An inverted yield curve could be a predictor of a recession, and in the US particularly, it has proved to be a fairly reliable indicator. It should be noted that there has not been a recession following every inverted yield curve, but for almost every recession there has been an inverted yield curve preceding it.
The Australian yield curve also inverted around the same time, but this is a less reliable indicator of a recession. Between 2007 and mid-2019 the Australian yield curve inverted six times and did not lead to a recession, but it does sometimes indicate that the RBA is going to cut rates. If they don’t, there will likely be low growth and inflation over the coming years.
Summary
An inverted yield curve doesn’t mean we’re headed straight for a recession, but it could be a warning sign.
[ls_content_block id=”27643″ para=”paragraphs”]