SaaS valuation multiples can be confusing but in the investing video below I will explain how to calculate churn, retention, gross profit margins, LTV, CAC and ARPU for any company — not just sexy tech stocks.
Private & Public (Stock Market) SaaS Valuation Explained
Total Users = Last year’s users + new ones
Let’s start at the top. Total users.
Most SaaS companies will tell you how many customers they have. For companies on the stock market, this detail is usually in the millions or — in some cases — billions of users (see Facebook).
It’s common practice for companies to tell you, the investors, how many users were added during a period (e.g. a quarter, year, etc.). From this information, you can estimate many important factors, such as:
- Customer Acquisition Cost or CAC (see below)
- Churn & retention (see below)
Help! I can’t find “total users” in the financial statements
Look in the company’s analyst presentations, listen to their quarterly analyst calls or ask management/IR. If you cannot find the numbers you want, it could mean that the management team keep them a secret.
Fortunately, you can easily estimate how many users a company has or is getting by:
- Looking at App store downloads
- Being part of multiple online groups or forums and estimating how many ‘fans’ or members are joining up. Tip: change in the Facebook page likes, Instagram followers, YouTube views and subscribers, and other social data can also be a good leading proxy for demand.
- Use Google or third-party analytics software (e.g. if website traffic or search interest goes up 20% in 3 months, you can bet more customers are onboarding)
- Buy or find trade/industry papers and reports
Customer Acquisition Cost (CAC) = cost to acquire or onboard a customer
CAC represents the cost or spending that’s required to get a user to pay for a product. This is usually the sales, marketing, communications, implementation & distribution costs (plus another other variable costs) shown in the financial statements.
For example, let’s say a company spends $10 million on marketing and sales. You can find this info on the Income Statement or in the Notes to Financial Statements.
You also determine or know that the company added 250,000 new paying customers or users. The cost of acquisition or CAC, therefore, is $10 million / 250,000 = $40 per customer.
Don’t be fooled by the CAC…
It’s not necessarily a bad thing if it costs a lot of money to acquire each customer. Every company is different. Even within a company, different customers can be worth more or less.
The important thing to remember is whether the company is getting paid back or covering the CAC. Is it worth spending $40 if the customer only pays $20 once-off? You know that by comparing it to the average revenue per user (APRU) and lifetime value (LTV) figures — explained below.
For example, if a company pays $50 instead of $40 to acquire a new customer but that customer spends $100 per year (APRU = $100), that’s great! It means there’s $50 of gross profit for the company.
Gross Profit (%)
Gross profit = revenue – costs to acquire the customer and deliver the product. Take this example of Xero:
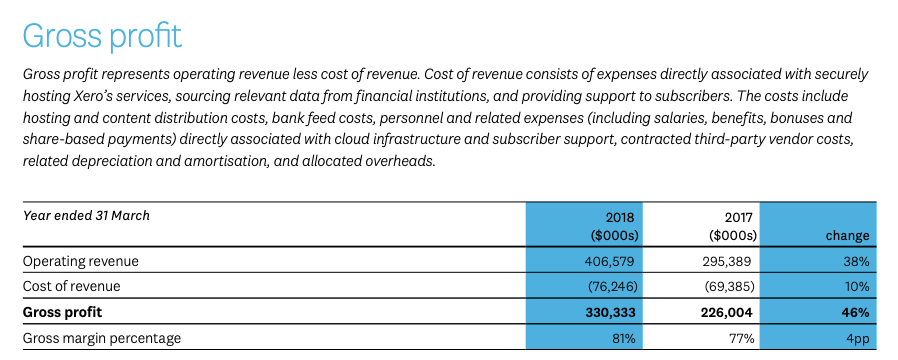
The gross profit margin in percentage is what we use for SaaS metrics and multiples. If the gross profit is $500,000 on revenue of $750,000, that’s $500,000/$750,000 = 67% gross profit margin.
Retention or Customer lifetime (in years) = 1/churn%
Churn tells you how many users, in percentage, leave your company each year. For example, a 30% churn rate means 30 out of every 100 existing customers give up or stop paying for your product.
Tip: You can also measure churn in revenue terms. That is, how much does the average customer keep spending in terms of revenue.
Retention is virtually the opposite of churn. For example, 60% retention means 60 out of every 100 existing customers keep paying for your product.
| Churn rate | 5% | 10% | 20% | 50% |
| Fraction (same as churn) | 1/20 | 1/10 | 1/5 | 1/2 |
| Retention (in years) | 20 | 10 | 5 | 2 |
Customer lifetime = 1/churn. For example, if the churn is 20% the customer lifetime is 1/20% = 5 years. This tells you how long an ‘average’ customer will use the company’s products. Longer = better.
More retention (i.e. lower churn) boosts your SaaS valuation.
Where do you find this information?
Look for investor/analyst reports and half-yearly or annual reports
Help! I can’t find the churn or retention number
Imagine a company’s management team tells investors, “we have 100,000 customers today and we added 30,000 last year.” If you know that they had 80,000 customers last year, it means they lost 10,000 customers.
How do I know this?
Is it magic?
No. It’s math.
Think about this: 80,000 customers (last year) + 30,000 (they added) = 110,000 customers. However, since they told you they have 100,000 (i.e. 10,000 less) you can calculate or estimate the ‘churn’ (or loss) of customers as being 10,000 / 80,000 = 12.5%.
Note: depending on the typical product’s contract length, the true churn number might be lower than 12.5%. For example, if there is no contract between customers and the company you might base your churn figure on the midpoint of last year’s and this year’s total users (e.g. between 80,000 and 100,000 = 90,000).
ARPU = Average Revenue Per User
If you have total user numbers, you can calculate ARPU very easily. It’s revenue (for the year) / total users. That’s it!
Obviously, a company can increase its ARPU by:
- Increasing product prices. If a company (e.g. SAP, Apple, Microsoft) can charge more for the same product AND keep their customers, it’s likely the company has a strong competitive advantage and pricing power.
- Cross-selling new or complementary products. Analysts use a term called the “take rate” to identify how many customers “take up” a new offer or product. This adds value to the company because they don’t have to pay the full CAC again for an existing customer.
LTV = Lifetime Value = ARPU x Gross Margin (%) x Customer Lifetime (years)
The lifetime value or LTV tells you what each customer is worth to the company over the expected lifetime of that customer. The LTV is based on three factors that are EXTREMELY IMPORTANT in valuation:
- ARPU
- Gross profit margin (%) (i.e. how much revenue exceeds acquisition cost of sales)
- Customer lifetime (which is calculated using churn/retention)
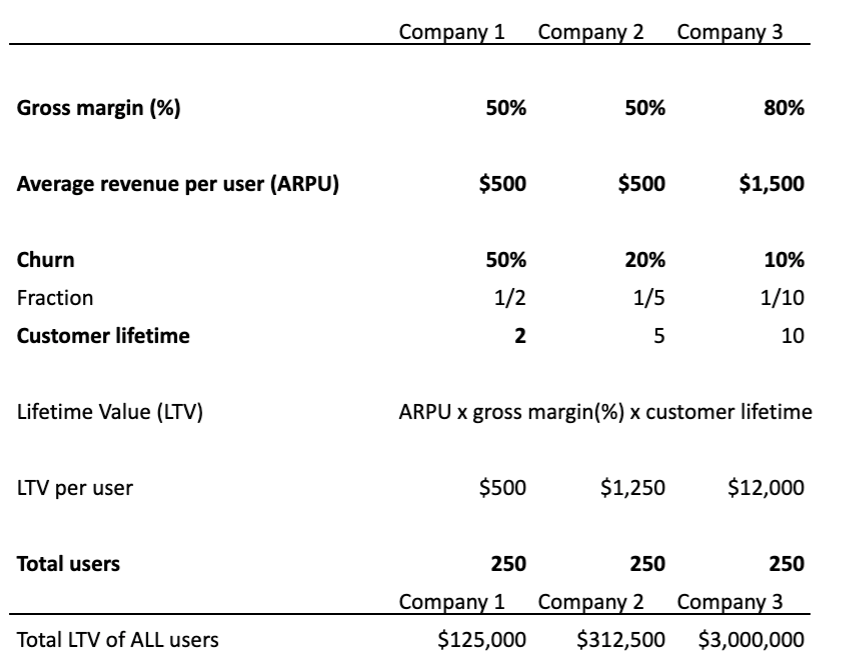
In the example above, take a look at Company 1 and Company 2. Do you notice how the churn number affects the customer lifetime which then significantly affects the value of all customers? It’s the difference between $125,000 and $312,500 in value. The only difference is churn.
If you can combine high retention (i.e. longer customer lifetimes) with more expensive products (ARPU) AND wider gross margins you could have the recipe for a fantastically profitable company.
But don’t get caught with pretenders. And always double-check your numbers because SaaS multiples are not perfect…
CAC Vs. ARPU Vs. LTV Vs. Cashflow
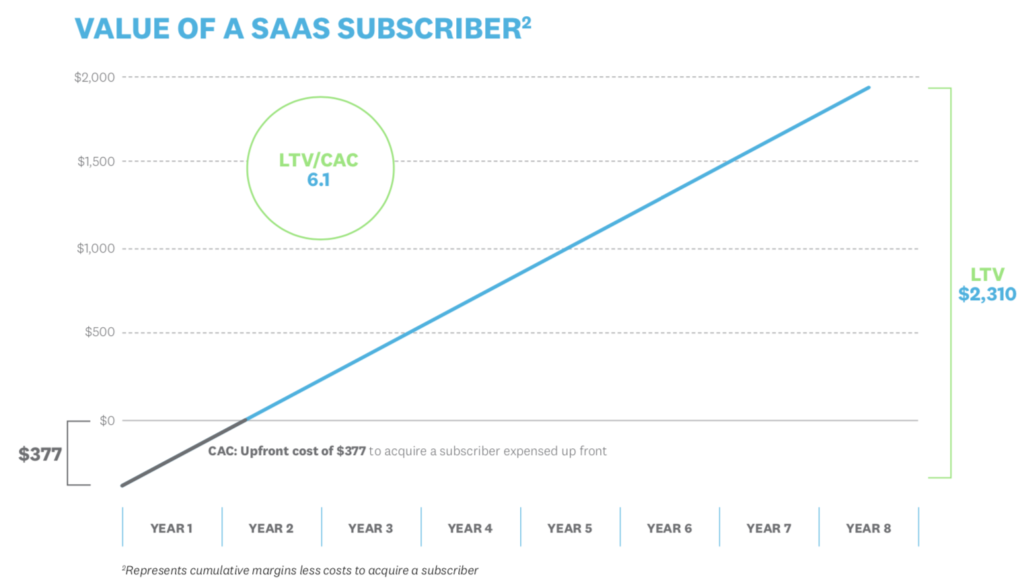
As an analyst, you must track ARPU and CAC over many years to make sure your company is still spending its marketing money wisely. You need to keep tabs on the cost (CAC) to acquire new customers and ensure the company’s average revenue per user (ARPU) or LTV exceeds it.
For example, ideally, the company should be spending less to get a new customer (CAC) than they make from him or her (ARPU) in a year.
If the ARPU is NOT higher than CAC, it’s not always a bad thing provided the LTV is substantially higher than the CAC and the company has the cashflow to ensure it doesn’t go bust before it realises the value from the customer in the future. Remember, LTV is the total value of the customer over the ENTIRE lifetime…
If the customer is paying the company $10 this year and you estimate she will do that for the next 10 years, the company can still go bust if it pays $70 to acquire her as a customer today. That’s because there’s a mismatch in cash outflow and cash inflow.
Bottom line – be careful
SaaS metrics are great, easy to calculate and powerful.
However, they’re not perfect (tax and financing costs, anyone?) so you should always cross-check your valuations by using something like a DCF analysis or earnings-based valuation (e.g. IRR). You can take our FREE course on DCF valuation and IRR by clicking here to view our courses.
Thanks for reading. Send me an email if you have any questions or feedback.